This lesson is designed to take you on an engaging journey through the fundamental concepts of experimental design, helping you understand how to systematically investigate cause-and-effect relationships. Throughout the lesson, you’ll gain valuable insights into identifying variables, minimizing bias, and optimizing your experiment's validity and reliability.
My name is Dr. Nurulhuda Ramli, and I will be your course manager. Feel free to reach out to me you have questions or need assistance.
Before diving into the lesson, let’s take a moment to review some important aspects that will help you navigate through the course successfully.
In this lesson, we’ll explore the following key areas:
By the end of this session, you will be able to:
To help you plan your time effectively, here’s an estimate of how long each section may take:
Feel free to work through the material at your own pace. It’s important to allocate enough time for reflection and practice to fully absorb the concepts.
Let’s get started on this exciting journey of discovery!
Course Manager,
Dr. Nurulhuda Ramli
⚙️🔍⏩
"The purpose of statistical science is to provide an objective basis for the analysis of problems in which the data depart from the laws of exact causality."
- D. J. Finney, An Introduction to Statistical Science in Agriculture
Have you ever found yourself wondering about experiments you encountered back in high school or junior high? Do you remember the steps? You might recall deciding on a phenomenon to study, manipulating factors, and measuring the response to understand the outcome.
For example, when running an experiment, you might have to manipulate one factor—like temperature—while holding others constant to ensure no external conditions affect your results. If changing the factor leads to a change in the outcome, you’ve uncovered a cause-and-effect relationship.
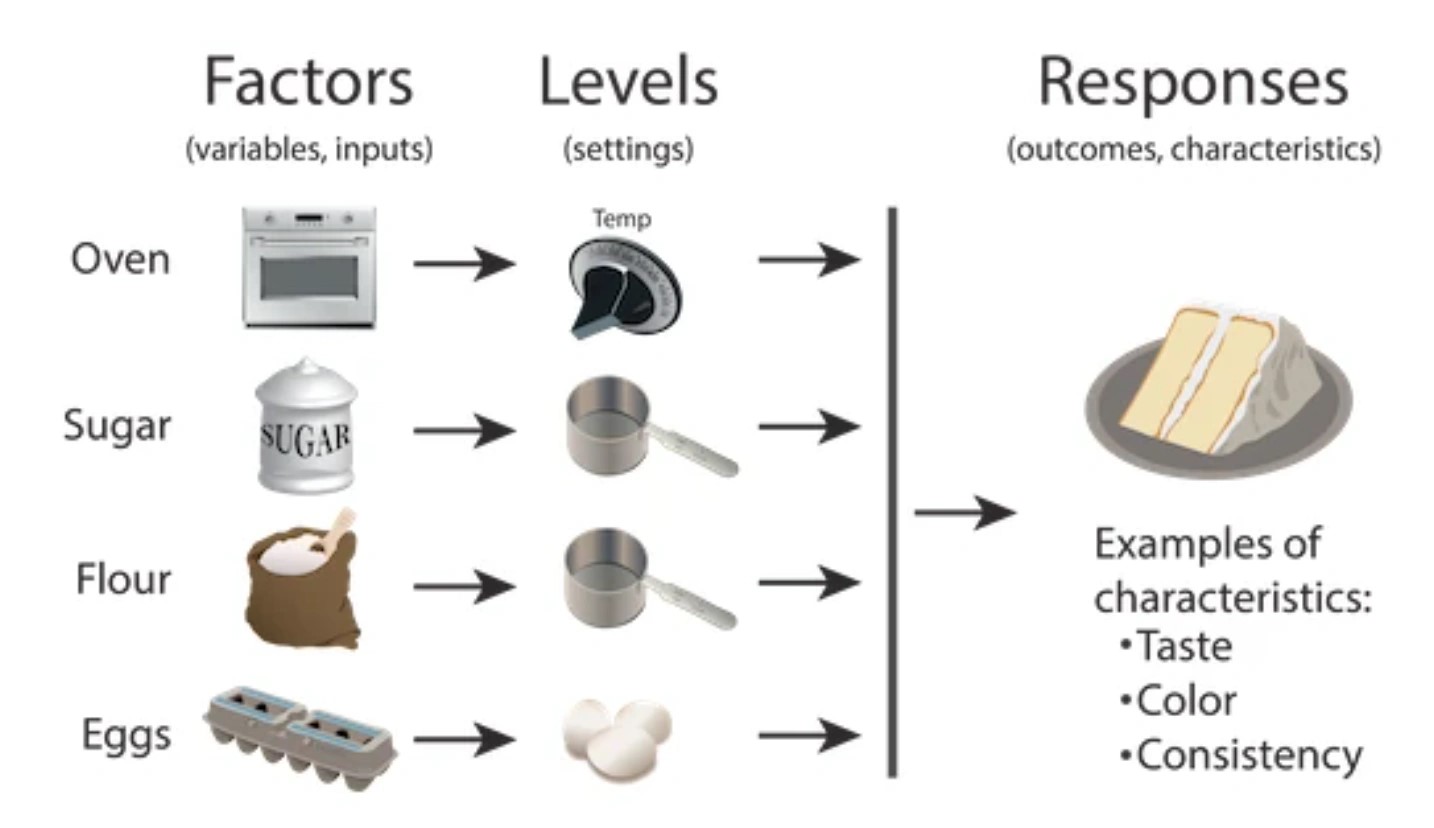
Think about how many factors you consider when conducting an experiment. Sometimes there’s only one, perhaps in a simple comparative experiment with a treatment group and a control group. But other experiments, such as baking a cake, involve many more factors—baking time, temperature, moisture, ingredients, and even the method of preparation. Someone had to experiment with all these variables to perfect the recipe.

Now imagine if you varied just one factor while keeping the rest
constant to see what would happen. It’s an approach, but it’s not very
efficient. In this course, we’ll explore how to design experiments more
effectively by understanding the role of multiple factors and how they
interact.
By the end of the course, you’ll be able to design robust experiments and confidently investigate the world around you.
🤗📑 Let’s start the journey! 💻🌟
All of the main learning sources for this topic is supplied here. To navigate to the previous or next page, please use the UP 🔼 and DOWN 🔽 arrows in the upper right corner of the display. You are welcome to explore at your own speed. Enjoy reading and exploring!
Subtopic 2: Basic Statistical Concept
In this topic, we consider experiments to compare two conditions (sometimes called treatments). These are often called simple comparative experiments. We begin with an example of an experiment performed to determine whether two different formulations of a product give equivalent results. The discussion leads to a review of several basic statistical concepts, such as graphical description of variability, probability distributions and mean, variance, and expected values.
The main learning material for this subtopic can be found here. Help yourself to navigate the pages at your own pace.
Imagine you are a researcher tasked with designing a study to test the effect of instructor communication style on participants' performance in spin classes. Participants will be assigned to one of two groups:
Your goal is to set up a Completely Randomized Design (CRD) for this experiment.
Key Question:
Share your approach and discuss any challenges you foresee in setting up this CRD effectively.
*Learning outcome from this activity: Able to identify basic principle of experimental design
Understanding Variability in Experimental Design
It is important to understand the concept of variability in experimental design.
Please watch the following video on variability. After watching, identify different types of variability that may affect the outcomes of an experiment.
*Learning outcome from this activity: Able to explain and apply key statistical concepts in experimental design
In this section, you will have the opportunity to test your acquired knowledge throughout the lesson. This questions will assess your understanding in achieving the following learning outcomes:
✔️Identify the basic principles of experimental design
✔️Explain and apply key statistical concepts to analyze and interpret data.
Don't miss the chance to demonstrate everything you've learned so far!
Watch the following video to enhance your understanding of the basic concepts of experimental design.
The following key terms provides a brief definition of key terms and concepts as they are used in this lesson.
LESSON RECAP 📑
In this topic, we covered essential concepts for experimental design and statistical analysis. We examined the principles of experimental design, focusing on randomization, replication, and control to ensure reliable and valid results. We also explored basic statistical concepts, including graphical methods for visualizing data variability, various probability distributions, and fundamental measures such as the mean, variance, and expected value. These concepts are crucial for effectively analyzing experimental data and drawing informed conclusions.
As we move forward, be prepared to build on this knowledge with new concepts that will deepen your understanding. Stay curious and engaged as we explore the next topic together.
Happy studying, and let’s get ready for the exciting material ahead!
🤗💻🌟